Adjusting Reality...
Are Satellite Sea-Level Measurements Being Inflated?
Sea level is one of those metrics we’re constantly told reveals the truth about climate change. It’s rising, they say, and accelerating, proof that human-caused warming is destabilizing the planet. But few stop to ask: what exactly is “sea level,” and how do we even measure it?
Contrary to popular belief, sea level isn’t some single, universal number that rises and falls uniformly across the globe. It’s a highly localized and variable phenomenon influenced by a range of factors: ocean currents, land subsidence, tectonic shifts, glacial rebound, wind patterns, salinity, and even gravity. Yes, gravity. Even in the open ocean, sea level isn’t flat. Water is pulled into mounds and depressions by gravitational anomalies, subsurface mountains, oceanic trenches, and shifting masses deep below the surface. The idea of a uniform "global sea level" is a mathematical convenience, not a physical reality.
Historically, sea level was measured using tide gauges, fixed instruments installed at coastal locations that track sea height relative to land over time. These tools, which offer century-scale records, reveal that sea level has been rising at varying rates depending on location. In parts of Scandinavia, sea level appears to fall due to the land rebounding upward after the last Ice Age. In places like Jakarta or New Orleans, it rises faster due to land subsidence. These are real changes, regional in scale, rooted in geology as much as climate. So when someone shows you a single number for global sea-level rise, understand that it’s an abstraction stitched together from disparate realities.
Enter satellite altimetry. Since 1992, a series of Earth-orbiting satellites—TOPEX/Poseidon, Jason-1, Jason-2, and Jason-3, have been bouncing radar pulses off the ocean surface, measuring the time it takes for the signal to return, and using that to estimate sea surface height. But the raw radar data is almost unusable without massive adjustments. Signals have to be corrected for atmospheric interference, wave height, water vapor, satellite altitude, Earth’s gravitational field, and the wobbly orbit of the satellite itself. These corrections depend on models, assumptions, and data processing protocols that aren’t always transparent.
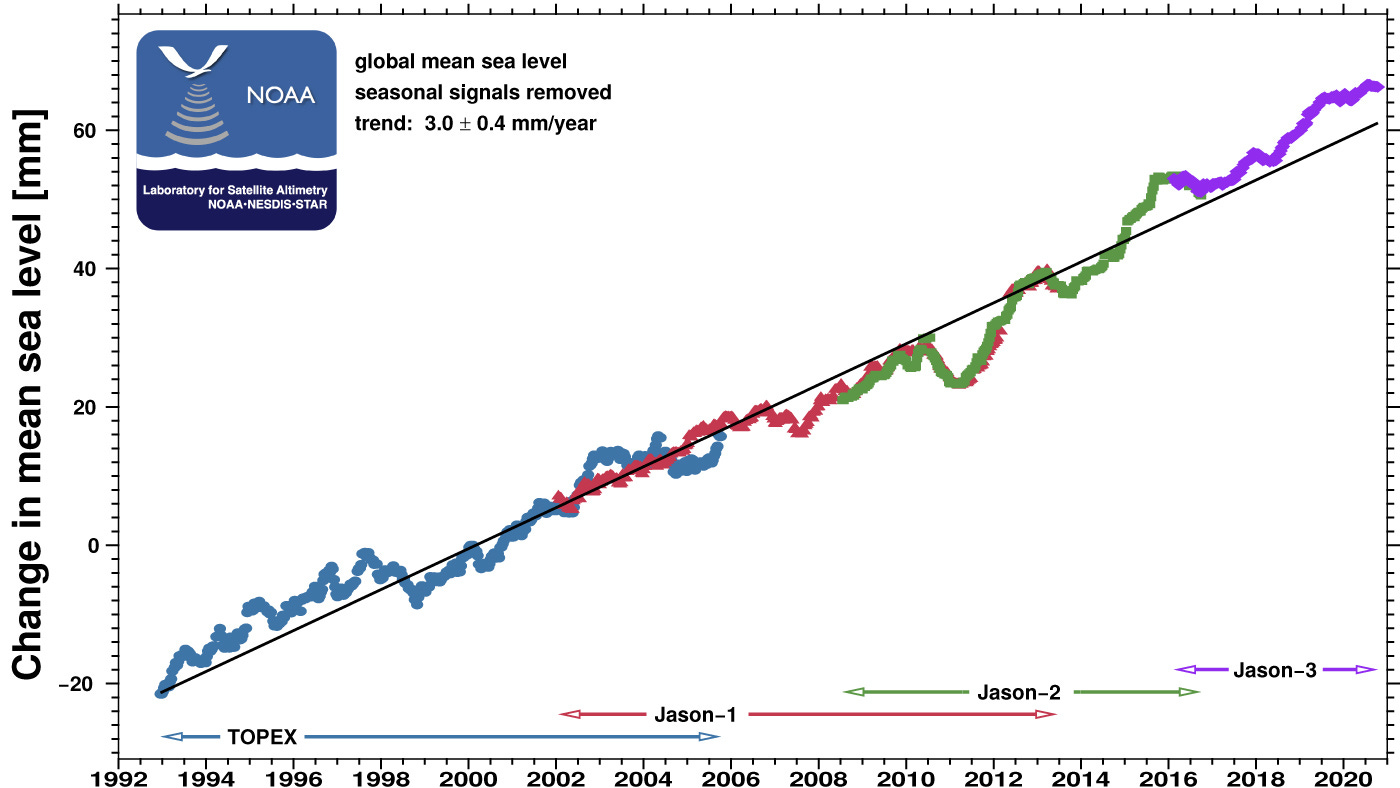
And here’s where things start to smell fishy. I recently came across an intriguing NOAA graphic that illustrates global mean sea-level rise as measured by these satellites.

The official record shows a clean, steady upward march of sea level at an average rate of 3.0 ± 0.4 mm per year since 1992. But if you look closely, every noticeable jump in the rate of sea-level rise aligns with the transition from one satellite to the next. Each new satellite “corrects” the record upward… never downward. Somehow, with every new generation of equipment, the urgency of the crisis deepens.


