Atmospheric Rivers: A Historical Perspective
Examining the Long-Term Data and the Role of CO2 in West Coast Precipitation Events
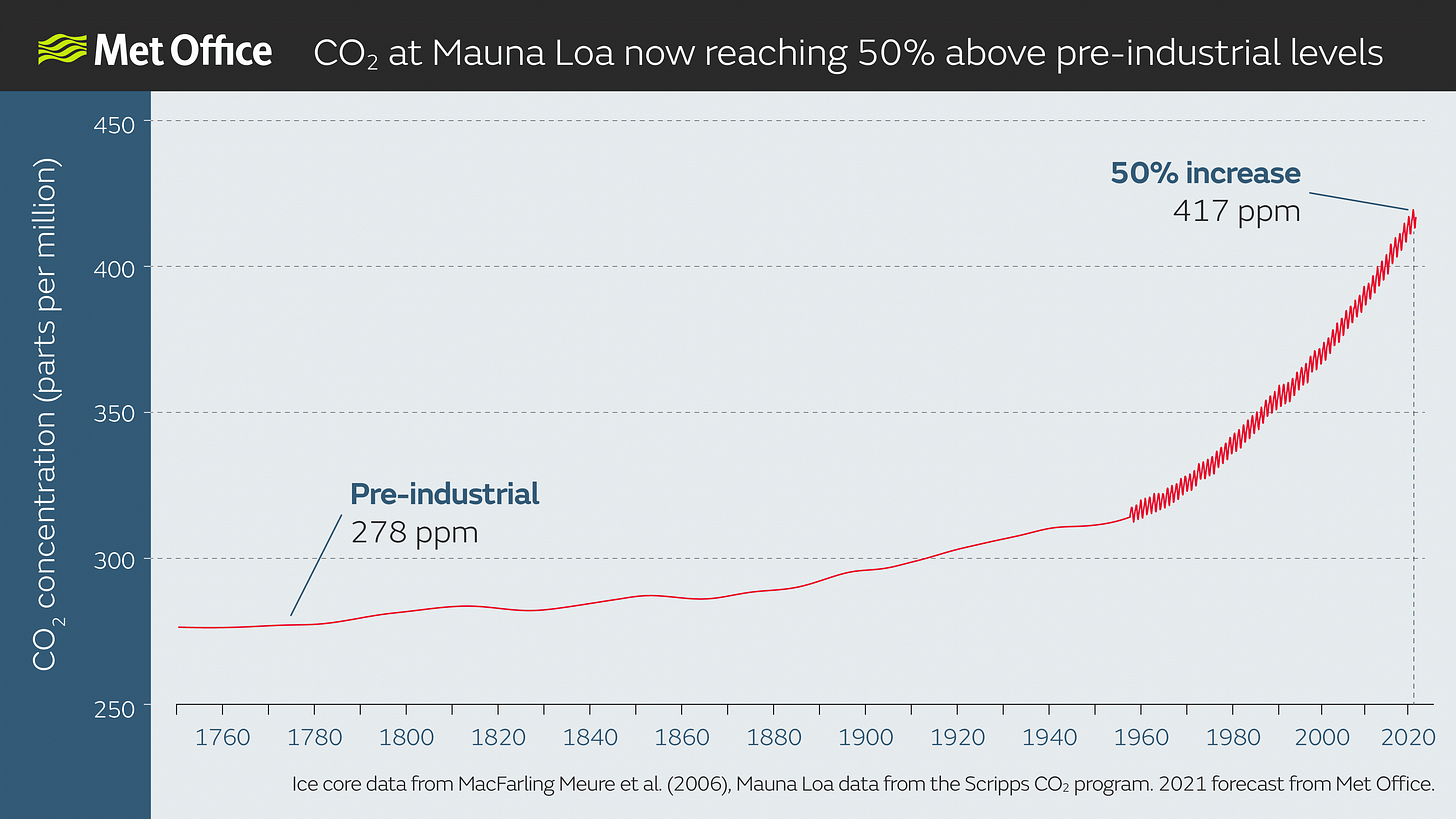
Atmospheric rivers, the elongated bands of water vapor in the atmosphere, play a crucial role in shaping the climate and hydrology of the West Coast of the United States. These meteorological phenomena are responsible for significant rainfall and snow events that replenish water supplies and influence weather patterns across the region. Recent studies have sparked a debate on the impact of rising CO2 levels on the frequency and intensity of atmospheric rivers. Contrary to popular expectations that higher CO2 concentrations would amplify these events, current research suggests that the incidence of atmospheric rivers along the West Coast has not experienced a significant increase attributable to carbon dioxide emissions. This article explores the dynamics of atmospheric rivers, examines the evidence from long-term weather stations, and discusses the implications of these findings for understanding the relationship between greenhouse gases (GHG) and regional weather patterns.
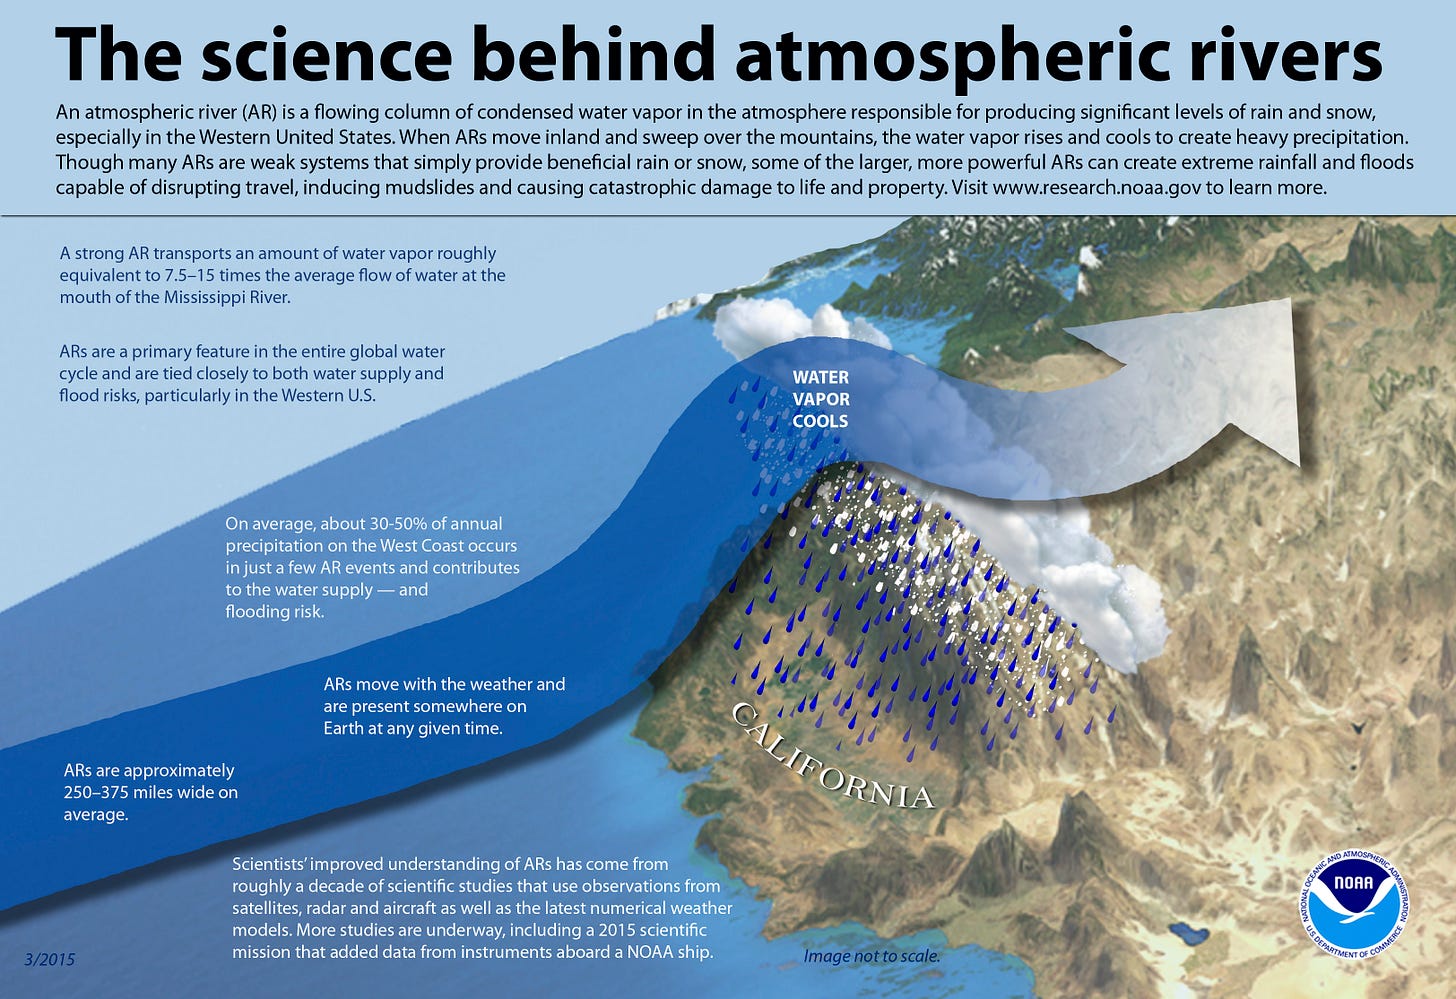
An atmospheric river is a concentrated flow of moisture suspended in the atmosphere, typically originating from tropical or subtropical regions and extending towards higher latitudes. These ribbons of moisture are often several thousand miles long but only a few hundred miles wide and are a key component in the global water cycle. They are responsible for transporting an amount of water vapor roughly equivalent to the average flow of water at the mouth of the Mississippi River. When these moisture-laden systems make landfall, they often release this water vapor in the form of rain or snow, profoundly impacting the regions they pass over, particularly in terms of precipitation and water supply.
The Intergovernmental Panel on Climate Change (IPCC) has studied atmospheric rivers as part of its ongoing assessment of climate dynamics. According to the IPCC, while climate change is expected to intensify certain aspects of the water cycle, including an increase in the intensity and frequency of heavy precipitation in some regions, the link between atmospheric rivers and climate change is complex and not fully understood. The IPCC reports suggest that while there is clear evidence of warming leading to changes in the water cycle, the specific impacts on atmospheric rivers vary greatly by region and are influenced by a host of local and regional climatic factors.
However, this doesn’t stop climate scientists and the MSM from continuously linking atmospheric rivers to increasing GHG concentrations. For example,
Atmospheric rivers are well-known weather phenomena along the West Coast. Several make landfall each winter, routinely delivering a hefty chunk of the area's annual precipitation. But the intensity of recent atmospheric rivers is almost certainly affected by human-caused climate change, says Daniel Swain, a climate scientist at the University of California, Los Angeles.
Source: https://www.npr.org/2024/02/06/1229226051/how-are-atmospheric-rivers-affected-by-climate-change
Skepticism regarding the impact of climate change on atmospheric rivers often revolves around the variability and uncertainty inherent in observational data and regional climate models. Critics argue that while global trends in temperature and precipitation can be modeled, the localized nature of atmospheric rivers makes it difficult to directly attribute changes in their behavior to global phenomena such as increased CO2 levels. They point out that discrepancies in model simulations and observational data regarding atmospheric rivers' frequency and intensity highlight the challenges in making definitive claims. Thus, while it is acknowledged that a warmer atmosphere can hold more moisture, translating this into a direct causal link to more frequent or intense atmospheric rivers remains a contentious and unresolved issue in climatology.
With that said let’s give it a shot with the generous help of Dr. John Christy, Distinguished Professor of Atmospheric Science and Director of the Earth System Science Center at The University of Alabama in Huntsville, who provided the data used below and is a fellow Fresnonian. Check out his book about climate change in the Central Valley, California here, with all proceeds going to UAH scholarships.
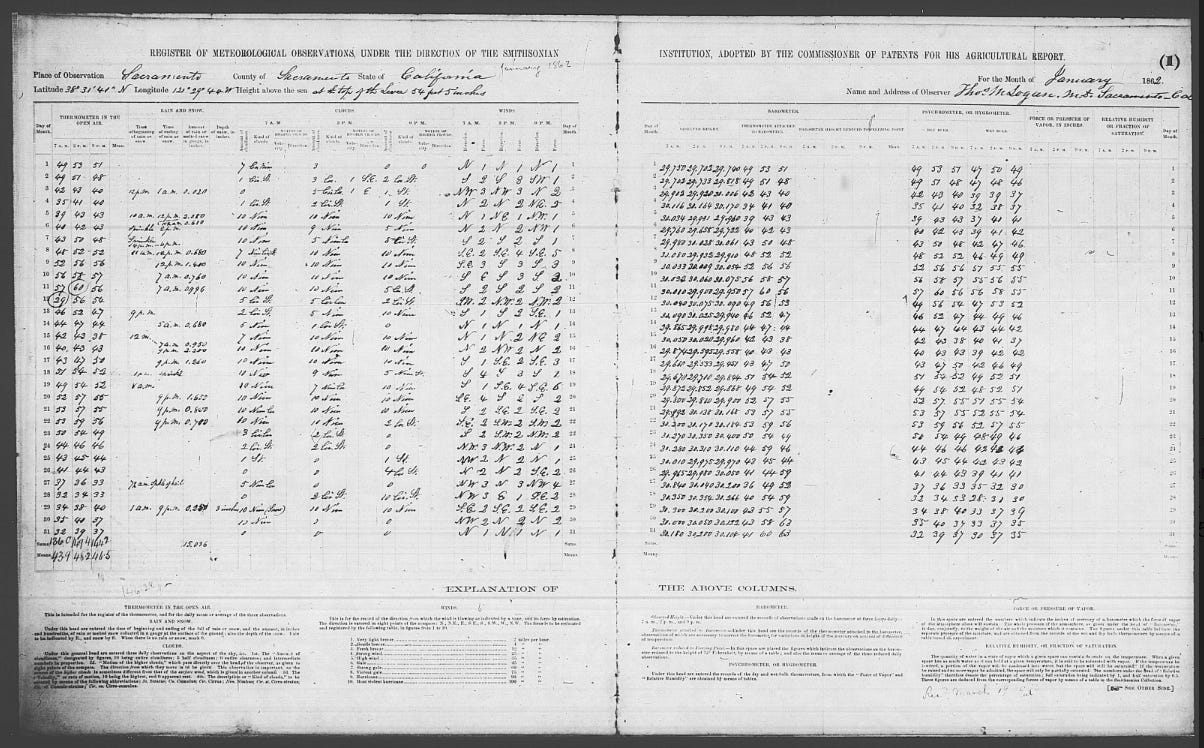
First, let’s establish a benchmark for precipitation events without anthropogenic influence on the atmosphere. The Great Flood of 1861-1862 remains one of the most extreme meteorological events in the recorded history of California, offering a unique historical benchmark to understand the scale and impact of mega-storms in a largely pre-industrial, pre-anthropogenic climate. This extraordinary event provides critical insights into natural climatic variability and the potential magnitude of meteorological phenomena absent significant human influence.

The 1861-62 storm was marked by an almost continuous series of atmospheric river (AR) events that pummeled the state of California from December 1861 to January 1862. The storm sequence transformed the Central Valley into an inland sea, reportedly 300 miles long and 20 miles wide, for up to three months. Cities were submerged, farms were destroyed, and the landscape was irrevocably altered, resulting in devastating economic and personal losses.

The catastrophe began with rains that fell continuously for 43 days, from the end of 1861 through the beginning of 1862. Sacramento was inundated under ten feet of water, forcing the temporary relocation of the state government to San Francisco. The flooding was so severe that it changed the course of the San Joaquin and Sacramento Rivers and left lasting impacts on the region's geomorphology and hydrology.
The 1861-62 event is particularly significant as it occurred before the widespread industrialization and urbanization of California. This timing is crucial because it suggests that the storm's intensity was not influenced by the increased greenhouse gas concentrations associated with later industrial activities. Therefore, it serves as a natural benchmark for understanding the upper limits of storm intensity and precipitation under more "natural" atmospheric conditions—those less influenced by human activity.

Studying the 1861-62 storm helps differentiate between natural variability and anthropogenic effects in historical climatic data. It provides a clear example of the kind of meteorological extremes that are possible in a pre-industrial climate, offering a baseline against which to measure the influence of contemporary anthropogenic changes.
Rather than focusing on metrics such as modeled probabilities, which predict future events and are inherently untestable, or the intensity of integrated vapor transport, for which we lack robust long-term data, we should consider more straightforward methods.
For example, here is a graphic by Dr. Christy that shows the distribution of the ten heaviest two-week periods of precipitation by region since 1892 for 29 stations distributed along the West Coast. The timescale of two weeks was chosen to indicate a several-day atmospheric river event.
Keep reading with a 7-day free trial
Subscribe to Irrational Fear to keep reading this post and get 7 days of free access to the full post archives.


