How to hide past climatic warming.
The very nature of climate reconstructions, specifically their granularity, smooths past warming to make current conditions appear unique.
Statistical peaks…
In statistics, when discussing the concept of "peaks", we are often referring to probability distributions. A peak in a probability distribution refers to its mode (or modes), which are the highest points on the distribution curve. The spread or "width" of the distribution is often influenced by its variance.
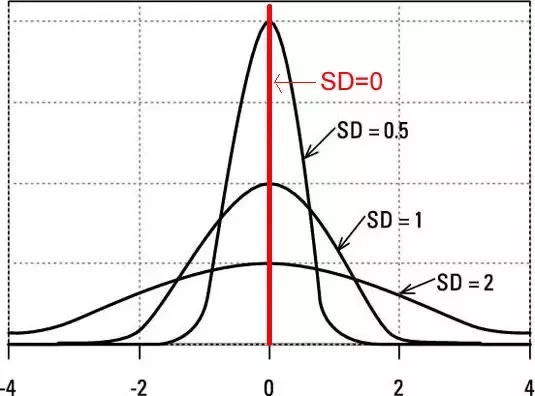
If we consider a normal distribution (a bell-shaped curve), the height of its peak is determined by its standard deviation (the square root of variance). Specifically:
Low Variance/Standard Deviation: The distribution is more peaked and less spread out. The values in the distribution are concentrated around the mean.
High Variance/Standard Deviation: The distribution is less peaked and more spread out. The values in the distribution are dispersed over a wider range.
So, if you increase the variance (or equivalently, the standard deviation) in a normal distribution, the peak will decrease and the curve will become wider and flatter. This happens because the same amount of data (or probability mass) is being spread over a wider range of values.
However, keep in mind that this explanation is specific to the normal distribution. Other distributions might behave differently. In general, though, for many symmetric, unimodal distributions, increasing the variance will lead to a decrease in the height of the primary peak.

Past climate reconstructions…
Proxy data, like tree rings, ice cores, pollen, and sediment layers, give us indirect evidence of past climate conditions. When thinking about the influence of variance in these datasets, consider the following:
Keep reading with a 7-day free trial
Subscribe to Irrational Fear to keep reading this post and get 7 days of free access to the full post archives.

