


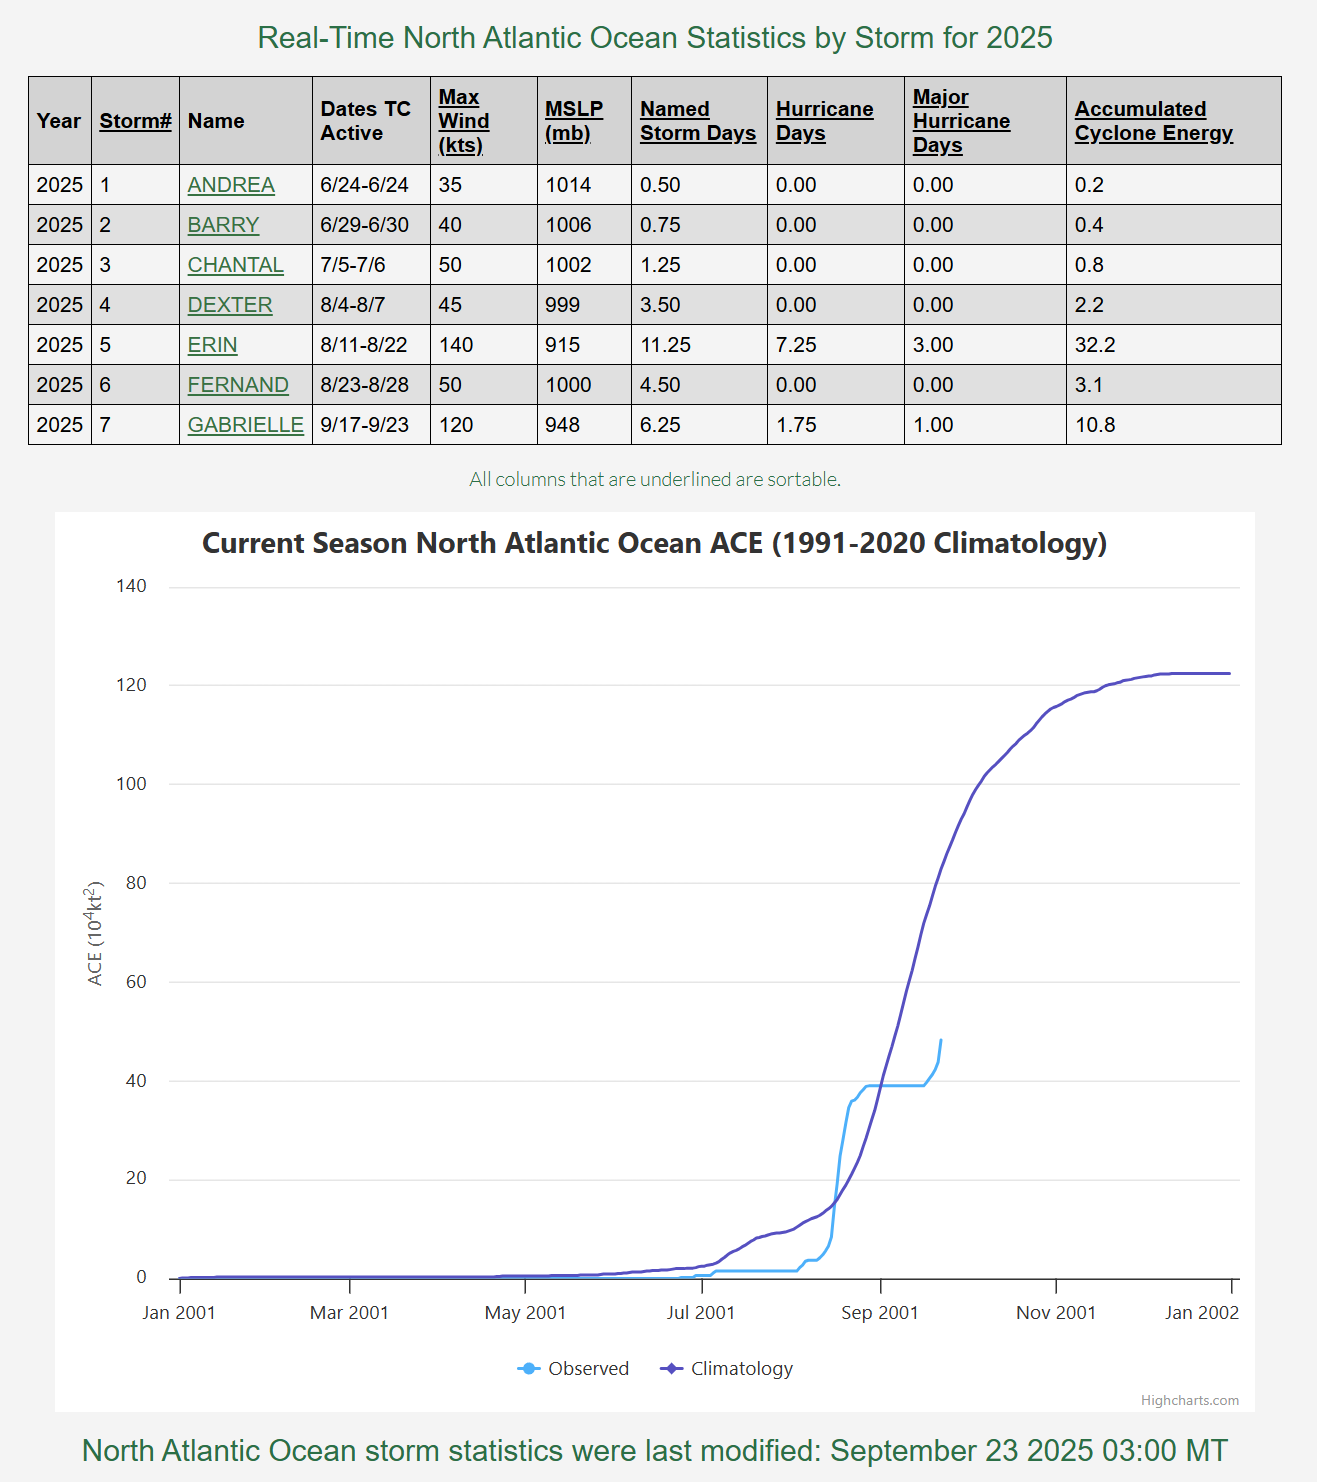
In the world of climate alarmism, anomalies are only newsworthy if they can be twisted to support the narrative of an impending catastrophe driven by human CO2 emissions. Scientists and media outlets seem to scour the globe for any unusual weather or ocean pattern that can be linked, however tenuously, to "global warming," while ignoring those that directly undermine their claims. Just last week, I highlighted the remarkable drought in North Atlantic hurricanes. This phenomenon hasn't been seen in nearly a century… although activity does appear to be picking back up this week.
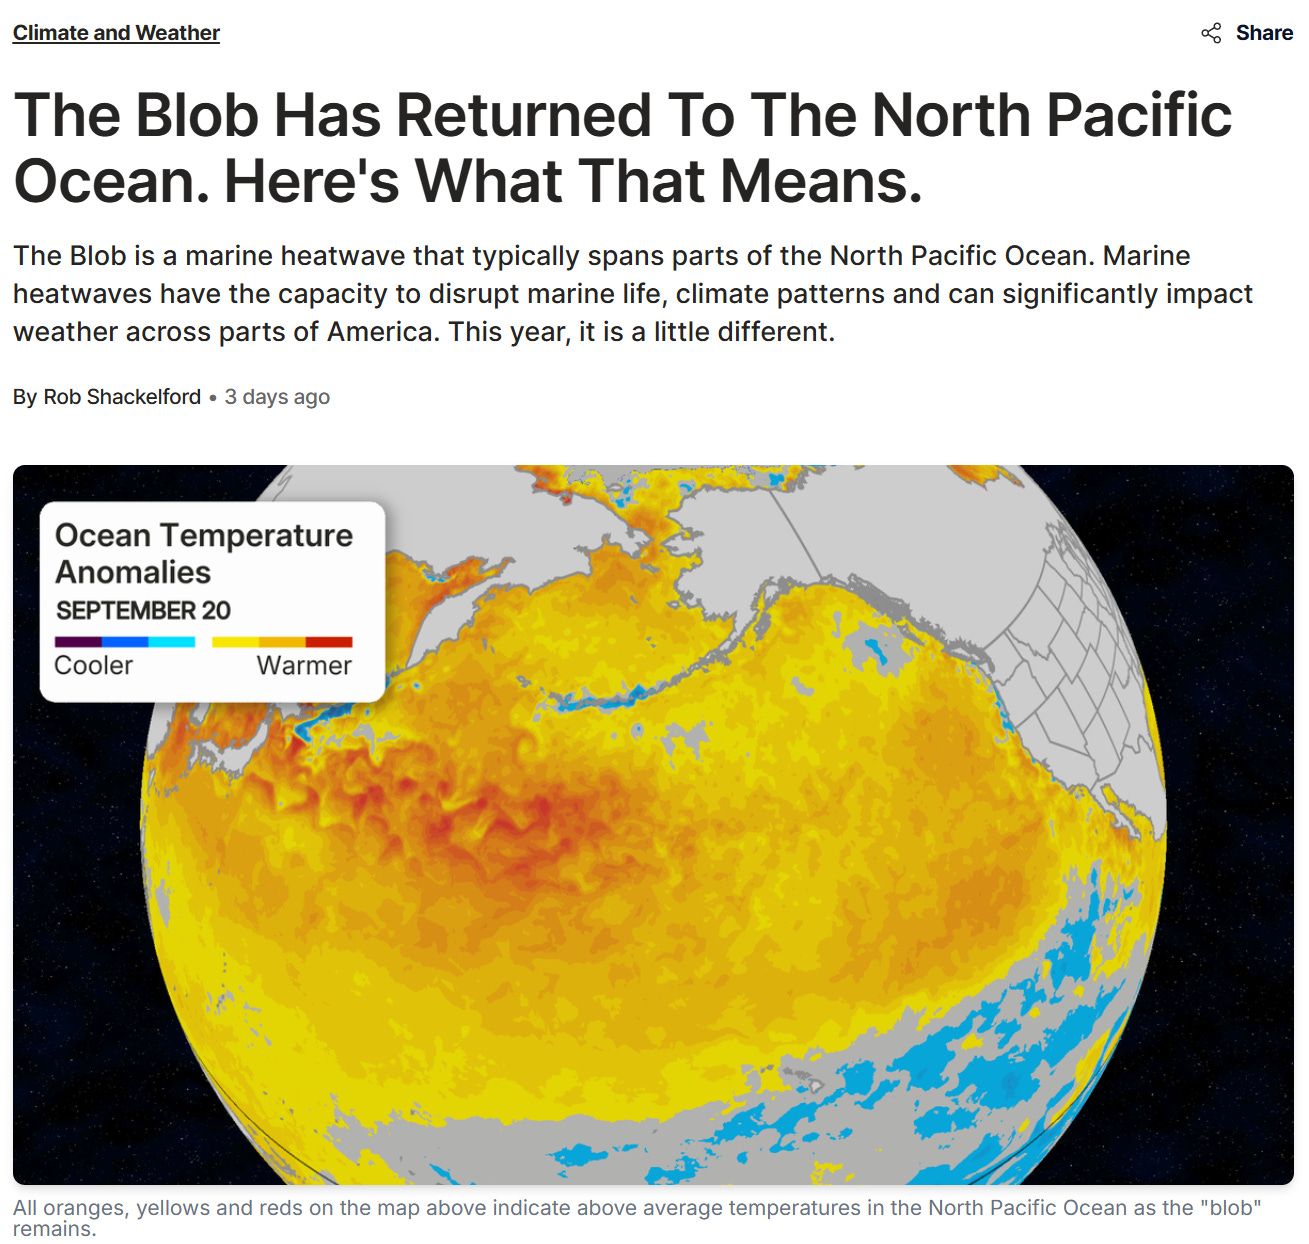
This week, the headline star is a warm patch in the North Pacific. Read a little and you will notice the same move every time. Report the dynamics that actually warm the surface, then pivot to greenhouse gases.
Weather.com explains the dynamics plainly. “The main culprit is a stubborn high-pressure system” that weakens the winds and “upwelling,” letting the surface layer warm. Then it adds the climate hook: “As our planet warms, the concern is that these Pacific blobs will become more frequent. And in fact, they are.”
Syndicated pieces do the same. Yahoo runs the line that the blob “is getting a significant boost from human-caused global warming.”
The Financial Times folds in the familiar talking point that the ocean “absorb[s] about 90% of greenhouse gas-induced heat,” before noting that reduced summer winds likely limited mixing this year.
Now compare those hooks to what the same articles admit about this event. Winds slackened. Upwelling was suppressed. Mixing dropped. Those are circulation stories, not GHGs behaving differently over one basin than another on the very same day. If CO₂ is the proximate cause of this week’s North Pacific warmth, are we also claiming CO₂ behaved differently over the North Atlantic, where we just saw a hurricane drought?
I have written extensively about this in the past. In “Where does ocean heat come from,” I show how little of the ocean we actually measure and why claims about precise basin-scale heat partitions are premature. My summary starts with the obvious blind spot: “Crustal heat flow is commonly overlooked in discussions of ocean heat content.” We also do not blanket the deep ocean with thermometers. “Significantly less than 10% of the world’s oceans have been sampled for temperatures at depths greater than 2000 meters.” I walk through hydrothermal and solar contributions and why “we don’t know where and in what proportions heat is entering the ocean system.”
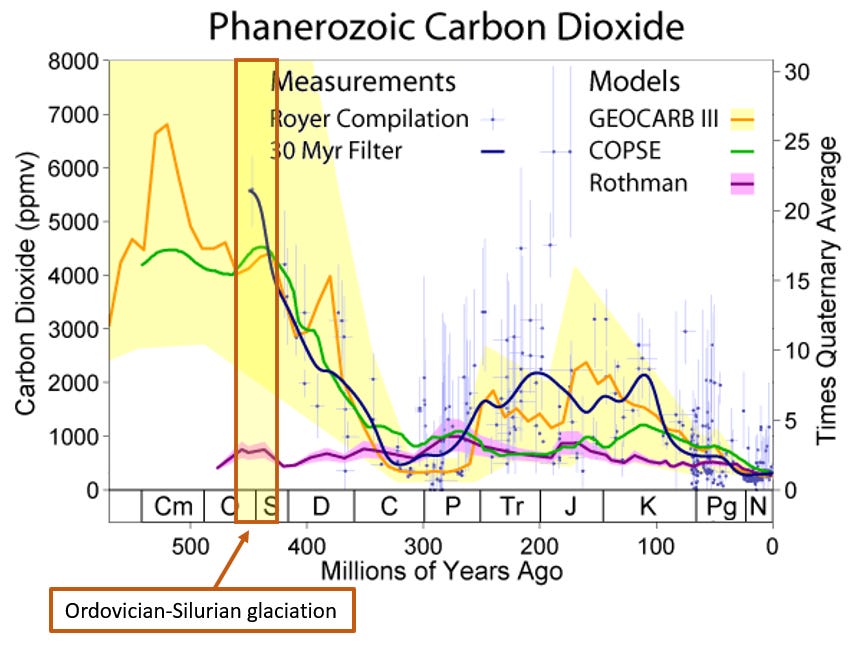
In “Does CO₂ drive global surface temperatures?” I put the geologic record front and center. The Ordovician–Silurian glaciation occurred during very high CO₂ and “highlights the relative insensitivity of global temperature to atmospheric CO₂ concentration.” The write-up closes with the same point in plainer language: “geologic evidence of past glaciations during elevated atmospheric CO₂ concentration highlights the relative insensitivity of surface temperature and atmospheric CO₂ concentration.”
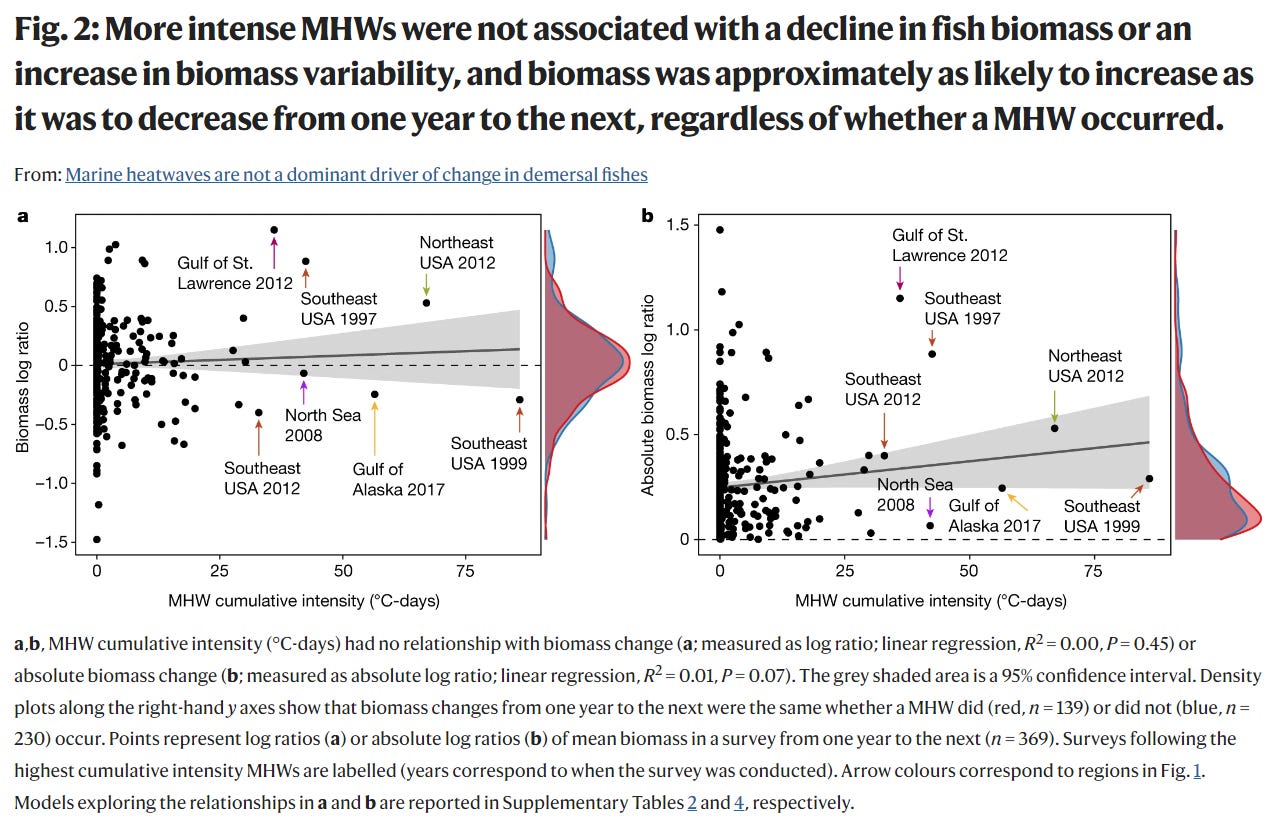
And in “Marine heatwaves,” I summarize new work in Nature that actually checks what happens to fish communities across hundreds of events rather than assuming collapse by headline. The study found the effects on fish biomass “were often minimal and could not be distinguished from natural and sampling variability,” and that big declines were “the exception, not the rule.”
Now, turning to the current "crisis" in the North Pacific: This warm patch, stretching from Japan to the U.S. West Coast. Media outlets are quick to blame it on climate change, implying the atmosphere is superheating the ocean. But is this evidence of CO2's dominance, or just natural variability in a system we barely monitor?
To dive deeper into media quotes that contradict their own narratives, plus exclusive analysis on why regional disparities debunk CO2 dominance, subscribe at IrrationalFear.com for this full piece and 400+ data-driven takedowns.
Keep reading with a 7-day free trial
Subscribe to Irrational Fear to keep reading this post and get 7 days of free access to the full post archives.