
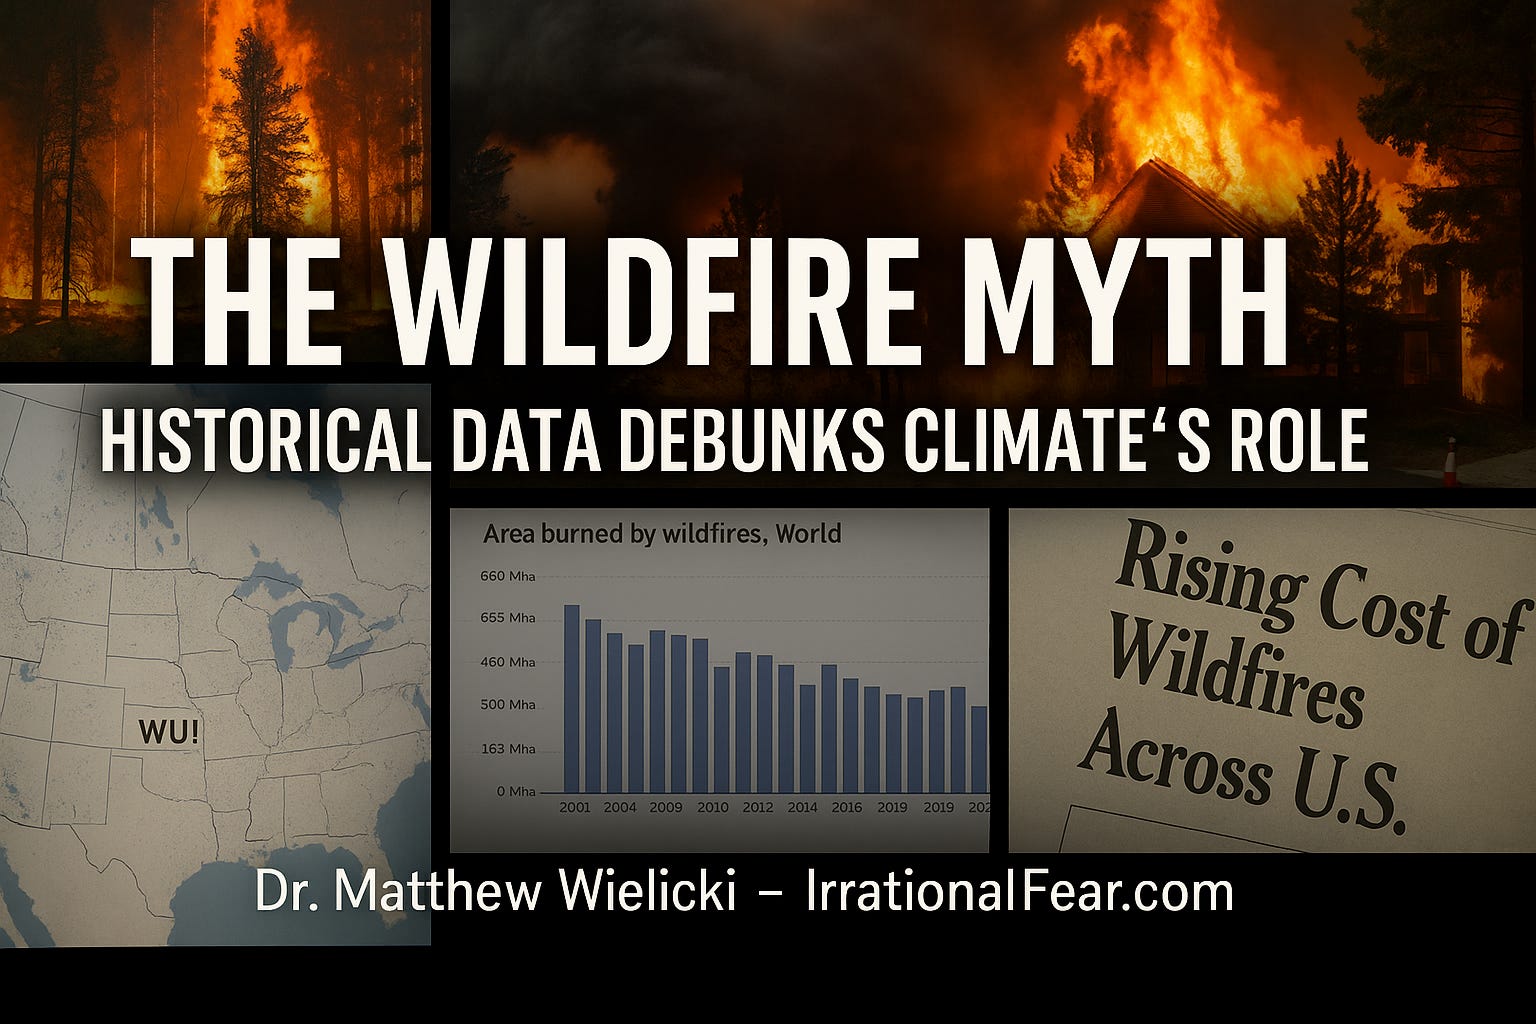
The Wildfire Myth: Historical Data Debunks Climate's Role
How cost headlines replaced wildfire measurements, and why the bills keep rising even when burn area doesn’t.

Summer’s End, Wildfire Headlines Keep Coming
As we approach the end of summer 2025, wildfire season is winding down across much of North America… though, as history shows, devastating fires can strike even in winter, like Southern California’s Palisades Fire. This seasonal lull offers a moment to reflect on the narratives surrounding wildfires, especially amid a noticeable shift in focus from their frequency and severity to economic costs. A recent New York Times piece, “Costly and Deadly Wildfires Really Are on the Rise, New Research Finds,” highlights this pivot, claiming catastrophic wildfires have surged more than fourfold from 1980 to 2023 due to climate-driven fire weather.
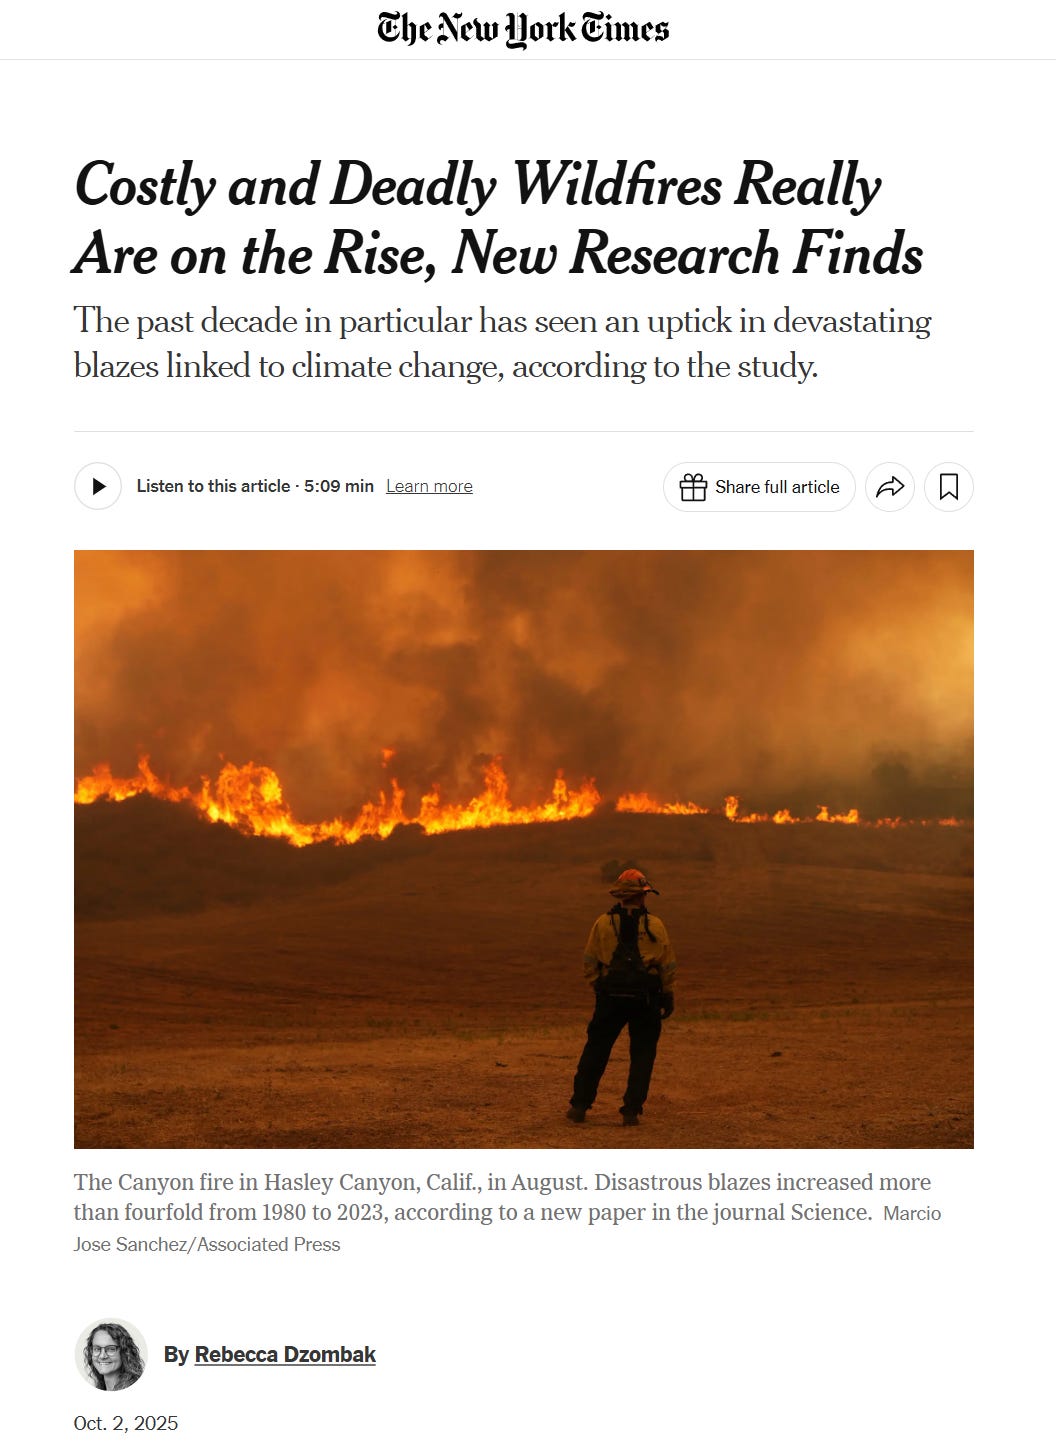
This cites a new paper that argues that disastrous wildfires spiked from 2015 onward, with 43% of the 200 most damaging events in the last decade alone, tied to intensifying climatic extremes.
This emphasis on costs mirrors tactics used in discussions of “billion-dollar disasters,” where rising damages are spotlighted when direct metrics like burn area or intensity don’t align with alarmist predictions. The IPCC has long projected in reports up to AR6 that climate change would amplify wildfire frequency and severity, yet observational data tells a different story. Globally, burned area has plummeted over recent decades, contradicting claims of a fire-fueled apocalypse.
When The Metric Doesn’t Move, The Story Does
For years, we were told climate change was already making fires more frequent and more severe everywhere. Yet the global satellite record shows a big decline in area burned since the early 2000s, especially in grasslands and savannas, while forests and croplands stay low and relatively flat.

So the narrative shifts. If frequency and severity won’t cooperate globally, focus on dollars. That’s the same trick used in “billion-dollar disasters”: track exposure and price inflation, call it climate.
What The Observations Actually Show
My past work has walked readers through the awkward facts:
A quiet U.S. 2023 even as Canada spiked: U.S. burned area was far below the 10-year average while Canada had a record year… evidence that fuel, ignition, and management dominate, not a CO₂ signal that conveniently respects the 49th parallel. Read more here.
Forest management and fuel age: radiocarbon work on the KNP Complex shows fuels feeding big California fires often average ~40 years old—decades of accumulation from suppression, not a new physics of CO₂. Read more here.
Policy and plantations: Chile’s worst fires map onto highly flammable eucalyptus/pine plantations and land-use change, not greenhouse gases. Read more here.
Lockdown logic: provinces in Canada used 2025 fires to justify sweeping access bans, even though national data show big year-to-year swings and no steady CO₂-driven march. Read more here.
All of these line up with the historical record: in North American boreal forests, modern burn rates are generally lower and less variable than the 1700–1900s baseline, with regional differences that track weather patterns and management, not a single global driver.
Why The Media Now Sells Bills, Not Burned Acres
Costs bake in exposure and price, two variables that rise even when hazard is flat. The “costs first” pivot lets editors write the same crisis headline whether or not the area burned cooperates. That’s not climate science; that’s climate propaganda.
The Cornerstone That Keeps Crumbling
One of the climate movement’s most important claims is not “temperatures rise,” but “cascading disasters rise.” Wildfires were supposed to be the textbook case. Yet long-context studies keep showing that today’s fire activity, even after a noisy year like 2023, sits within historical variability when you look beyond a couple of recent decades. We’ll dig into the latest papers below, but the bottom line for free readers is simple:
Global area burned is down.
Costs are up because we’re wealthier, build more in harm’s way, and suppress until fuels explode.
The IPCC’s confident story about steadily worsening fires has not aged well.
What You’ll Get If You Subscribe
Behind the paywall, I’ll unpack three things you won’t hear in the headlines:
The multi-century context for Canada’s 2023 spike: A new Canadian study compares 2014–2023 to reconstructions back to 1800 and finds decadal burn rates largely within historical ranges across most zones. We’ll walk through methods and maps.
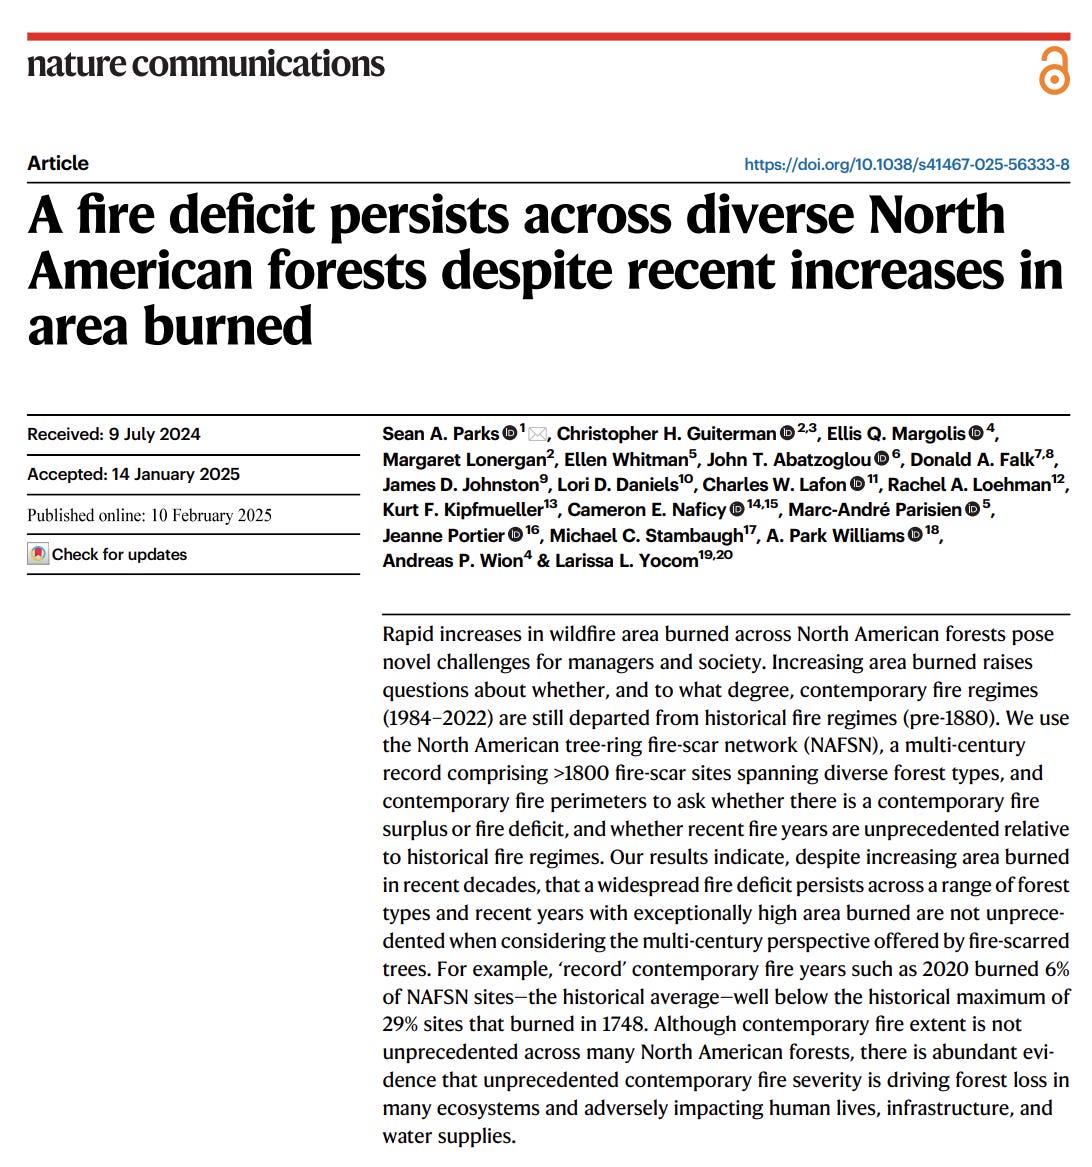
What Nature Communications just showed about “historic vs. contemporary” fire—including the role of fire exclusion, fuel build-up, and why total area burned can remain below historical levels even as certain regions see tough years.
I’ll line up those AR4/AR5 expectations against multi-century reconstructions and the new Canada updates through 2023, and show how the latest evidence fits—or doesn’t—with the older storyline.
If you want more than headlines, subscribe. The full post walks through the new peer-reviewed papers, shows the figures, and explains what they actually measure. You’ll also get access to 400+ analyses that replace crisis scripts with observations.
